Revenue at Risk: How to Spot Churn Before It Happens
Most SaaS companies find out about churn the same way: a cancellation notification lands in someone's inbox, and the scramble begins. By then, it is already too late. The customer mentally checked out weeks or months ago.
Churn is not an event. It is a process. The companies that grow efficiently are the ones that learn to read the early chapters of that story, not just the final page.
This post breaks down how to spot churn before it happens — the specific signals to watch, the framework for combining them, and the operational practices that turn early warnings into saved accounts.
The Problem with Churn Rate as Your Primary Metric
Churn rate is the metric everyone tracks. It shows up in board decks, investor updates, and monthly all-hands meetings. But here is the uncomfortable truth: churn rate is a lagging indicator. It tells you what already happened, not what is about to happen.
By the time a customer shows up in your churn rate, the damage is done. They have already stopped using your product, evaluated alternatives, made an internal decision, and gone through whatever cancellation flow you built. You are measuring the outcome, not the cause.
This does not mean churn rate is useless. It is essential for understanding your business at a macro level. But relying on it to prevent churn is like using an autopsy to practice medicine. You need vital signs, not a death certificate.
The shift that matters is moving from lagging metrics to leading signals — the behavioral and transactional patterns that predict churn days or weeks before it materializes.
Leading vs. Lagging: A Framework for Churn Prediction
Think of customer health in two dimensions: what they pay and what they do.
Revenue signals come from billing data. They tell you about payment patterns, plan changes, downgrades, and failed transactions. These are concrete and easy to track, but they tend to surface late in the churn cycle.
Product signals come from usage data. They tell you about login frequency, feature adoption, engagement depth, and activity trends. These are noisier but surface much earlier.
Neither dimension alone gives you the full picture. A customer who pays on time but has not logged in for three weeks is at risk. A customer who uses the product daily but just had a failed payment is at risk in a different way. The power comes from combining both.
This is the core principle: revenue data tells you where a customer stands today, and product data tells you where they are heading tomorrow. You need both to predict churn with any reliability.
The Signals That Actually Predict Churn
Not all behavioral changes are created equal. After studying patterns across SaaS businesses, a consistent set of leading indicators emerges. Here are the ones worth building your detection around.
Usage Frequency Decline
This is the most reliable early signal. When a customer who logged in daily starts logging in twice a week, something changed. The absolute numbers matter less than the trend. A 40-50% drop in login frequency over a two-week period is a strong predictor of churn within the next 60 days.
What makes this tricky is that usage patterns vary by customer segment. An enterprise account with five active users dropping to three is different from a single-seat startup account going quiet. Context matters.
Feature Abandonment
Customers who stop using the features that originally drove their purchase decision are sending a clear signal. If someone signed up specifically for your reporting module and has not opened it in three weeks, the value proposition that won them over is no longer landing.
Track not just overall usage, but usage of the features that correlate with long-term retention in your product. These are your "sticky" features, and when engagement with them drops, the clock starts ticking.
Support Silence
Counterintuitively, a drop in support tickets can be a warning sign. Customers who care enough to ask for help are still invested. When a previously engaged customer goes silent — no tickets, no feature requests, no feedback — they may have simply given up.
This is especially true for accounts that had an active onboarding period with lots of questions and then went completely quiet. That silence is not satisfaction. It is disengagement.
Payment Failures and Billing Friction
Failed payments are an obvious signal, but the pattern around them matters more than the individual event. A first-time payment failure that resolves automatically is routine. Repeated failures, especially combined with a lack of response to dunning emails, suggest the customer is not motivated to maintain the subscription.
Downgrades are another signal in this category. A customer moving from an annual to monthly plan, or from a higher tier to a lower one, is often testing the waters before canceling entirely.
Declining Breadth of Use
Early in the customer lifecycle, usage tends to expand — more team members, more features explored, more integrations connected. When that expansion stalls or reverses, it signals that the product is not becoming more embedded in the customer's workflow. It is becoming less embedded.
Watch for accounts where the number of active users is shrinking, where integrations are being disconnected, or where usage is consolidating to a single basic feature.
Churn Warning Signs Checklist
Use this as a practical reference for building your own early warning system:
- Login frequency dropped 40% or more over the past two weeks compared to the prior month
- Core feature usage declined significantly — especially features tied to the original purchase decision
- No support tickets or communication in 30+ days from a previously active account
- Payment failure unresolved for more than 7 days, or multiple failures in the past 90 days
- Plan downgrade from annual to monthly, or from a higher to lower tier
- Active user count declining — fewer team members logging in each week
- Onboarding milestones incomplete 30 days after signup
- Integration or API usage dropped to zero after previously being active
- No response to outreach — emails, in-app messages, or check-in calls going unanswered
- Contract renewal date approaching with no expansion conversations initiated
If an account shows three or more of these signals simultaneously, the probability of churn is high and intervention should be immediate.
Turning Signals into Action
Identifying risk is only half the problem. The other half is acting on it fast enough to make a difference. This is where most teams fall apart — not because they lack data, but because the data lives in disconnected systems and nobody owns the response.
The operational challenge is threefold. First, you need to combine revenue and product data into a unified view of customer health. Second, you need that view to update automatically, not depend on someone running a report every Monday. Third, you need the right action to trigger at the right time without manual intervention.
This is the problem Bigdelta was built to solve.
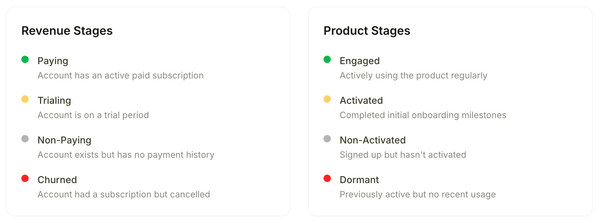
Bigdelta automatically categorizes every customer into Revenue Stages — Paying, Trialing, Non-Paying, Churned — based on billing data from Stripe, PayPal, or Solidgate. Simultaneously, it assigns Product Stages — Engaged, Activated, Non-Activated, Dormant — derived from actual usage and event data. These two dimensions update in real time, giving you the combined revenue-plus-product view that makes churn prediction possible.
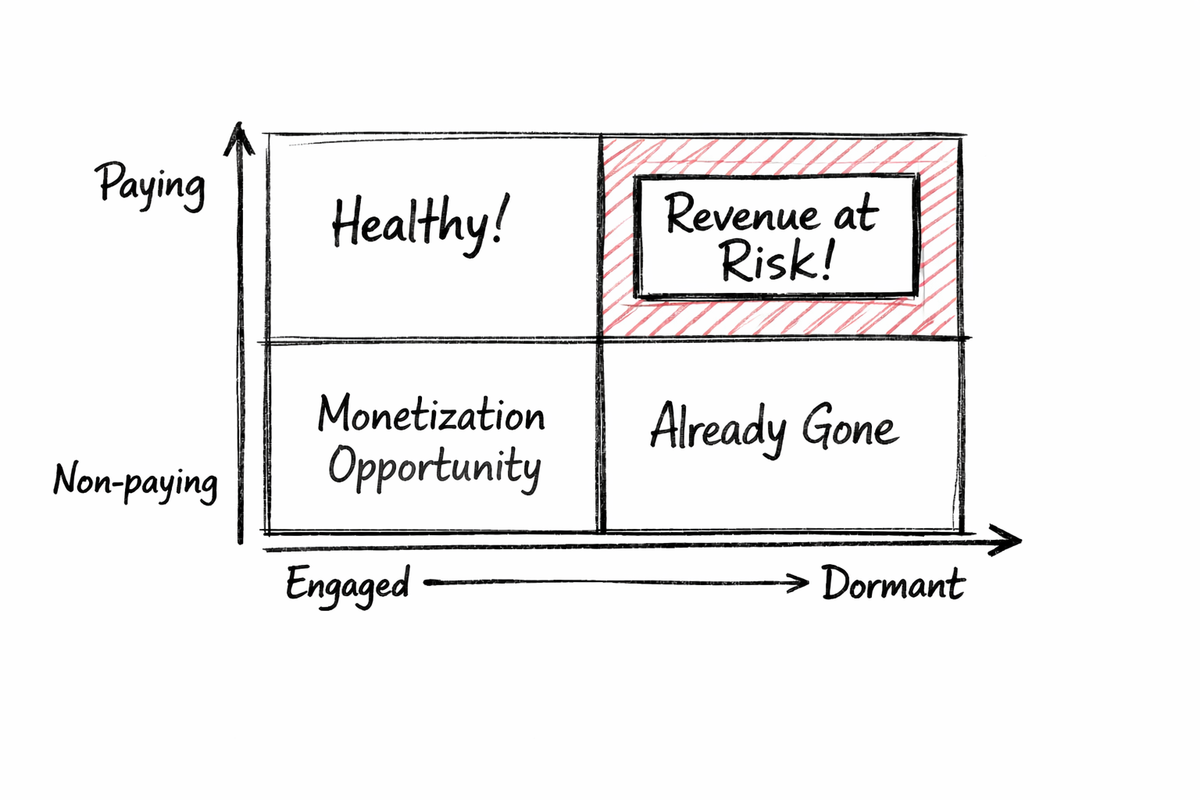
When a customer's Product Stage shifts from Engaged to Dormant while their Revenue Stage is still Paying, that is a clear at-risk signal. Bigdelta surfaces these patterns on the Home dashboard under Revenue at Risk, so you do not need to go hunting for problems — they come to you.
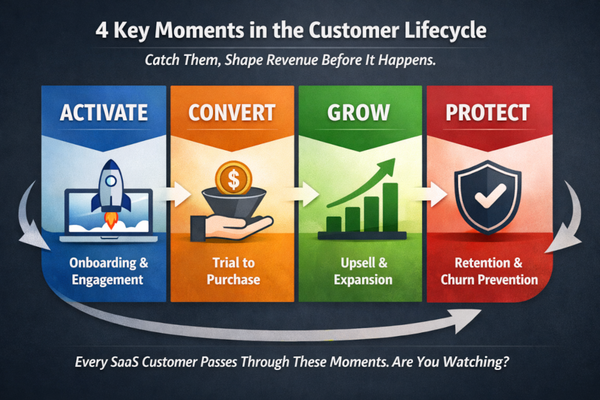
But visibility alone does not save accounts. What changes outcomes is automated action. Bigdelta Moments feature lets you build playbooks that trigger based on stage transitions and behavioral signals. When a paying customer goes dormant, you can automatically send a re-engagement email, notify the account owner in Slack, create a task in Attio CRM, or fire a webhook to any system in your stack. The response happens in minutes, not days.
This combination — automatic stage classification, real-time risk surfacing, and triggered playbooks — is what closes the gap between knowing a customer is at risk and actually doing something about it.
Building a Churn Prevention Culture
Tools and automation matter, but they work best inside a team that treats churn prevention as a continuous practice, not a quarterly fire drill.
Make risk visible to everyone. Churn is not just a CS problem. Product teams need to see which features correlate with retention. Marketing needs to know which acquisition channels produce customers that stick. Finance needs early warning to forecast accurately. Shared dashboards with real-time stage data make this possible.
Define ownership clearly. Every at-risk account should have a single person responsible for the save attempt. Automated alerts are useless if they land in a shared channel where everyone assumes someone else will handle it.
Close the feedback loop. When you save an account, document what worked. When you lose one, do a lightweight post-mortem. Over time, these learnings refine your signals and playbooks far more than any theoretical model.
Act early, act small. The best interventions do not feel like interventions. A well-timed check-in email, a proactive tip about an unused feature, a quick call to see how onboarding is going — these small touches, triggered at the right moment, prevent the big problems from forming.
Start Spotting Churn Before It Happens
Churn does not have to be a surprise. The signals are there — in your billing data, in your product usage logs, in the patterns of engagement and disengagement that play out across every customer relationship. The question is whether you have the systems in place to see them and act on them.
Bigdelta brings your revenue and product data together, automatically identifies customers at risk, and triggers the right response at the right time. No more spreadsheets, no more gut feelings, no more finding out about churn after the fact.
You can start using Bigdelta for free at bigdelta.com and see which of your customers need attention today.